Show code
load("benthicCoverXrefBenthicCodes.RData")This page aggregates algal taxa recorded across the three benthic monitoring programs and plots their percent cover through time at each survey site. Macroalgae and fleshy cyanobacteria are the two groups reported here, since both are prominent benthic primary producers that compete with coral for space. The page groups every survey record by algal taxon and averages cover across replicate transects at each site and year. It produces the faceted cover-over-time figure (Figure 1) and a downloadable long-format cover table (s2pt7_benthicCoverAlgaeTaxa) that feeds the downstream resilience and biodiversity pages.
This page uses the algal cover recorded by the three benthic monitoring programs: TCRMP, VINPS, and CSUN. VINPS and TCRMP resolve macroalgae to finer taxonomic groups, while CSUN macroalgae collapse to a single category because the available CSUN data lack that taxonomic resolution. It reads the reformatted per-program benthic cover and the benthic-code cross-reference produced in sections 2.1 and 2.2, filtered to the Macroalgae and Cyanobacteria categories, and orders facets by depth from the site master table. The derived cover table this page builds is available in the Downloads section below.
TCRMP and VINPS record replicate transects at each site, so their site-year means carry standard error. CSUN has no site-level transect replicate, so CSUN cover is a single value per site-year and its points show no error bars. VINPS begins later than TCRMP, and CSUN carries the longest record. Read program differences with these structures in mind and never pool a single error bar across programs.
What happens here: the page loads the per-program benthic cover and the benthic-code cross-reference produced by the section 2.1 reformat and the section 2.2 cross-referencing step, then names the grouping variable and the output section tag used later for file naming.
load("benthicCoverXrefBenthicCodes.RData")subfoldername names where the grouped cover products are written. groupingvar sets the taxonomic grouping for this page (algaeTaxa). section tags the output filenames (s2pt7).
subfoldername <- "benthicCoverGrouped"
groupingvar <- "algaeTaxa"
section <- "s2pt7" # for namingbenthicDat into subgroupings of interestThe benthic-code cross-reference is filtered to the Macroalgae and Cyanobacteria categories, so the grouping below covers exactly the algal taxa and fleshy cyanobacteria reported on this page.
benthicCodes <-
  benthicCodes[which(
    benthicCodes$tcrmp_Category == "Macroalgae" |
benthicCodes$tcrmp_Category == "Cyanobacteria"),]getBenthicDatColInds()this is one of two functions that connect benthicDat to benthicCodes for all three programs.
getBenthicDatColInds() makes _columnInds that stores column indices of benthic codes corresponding to each item of algaeTaxa
arguments:
benthicDat is benthic dataset of interest
codecolumn is the name of the column of benthic code containing the code for benthicdat
groupingcolumn is the name of the column of benthic codes where the grouping variable of interest is stored.
getBenthicDatColInds <-
  function(benthicDat, codecolumn, groupingcolumn) {
    codecolind <-
      which(colnames(benthicCodes) == codecolumn)
    groupingcolind <-
      which(colnames(benthicCodes) == groupingcolumn)
    genusdf <-
      data.frame(group =
                   unique(benthicCodes[, groupingcolind]),
                 colinds =
                   rep(0, length(unique(benthicCodes[, groupingcolind]))))
    for (i in 1:nrow(genusdf)) {
      codei <-
        benthicCodes[which(benthicCodes[, groupingcolind] == genusdf$group[i]), ]
      genusdf$colinds[i] <-
        list(which(colnames(benthicDat) %in% codei[, codecolind]))
    }
    # UAGA-guard: warn on benthicDat data columns whose code is absent from benthicCodes and is
    # therefore silently dropped (the footgun that lost VINPS Agaricia agaricites, code UAGA).
    .known <- benthicCodes[[codecolind]]; .known <- .known[nchar(.known) > 0]
    .meta_cols <- c("program","date","site","period","replicate","replicatetype","nopts",
                    "Year","Date","SiteFullName","year","month","percentCover_allCoral",
                    "PC","Check","Notes","Transect")
    .dropped <- setdiff(colnames(benthicDat), c(.known, .meta_cols))
    if (length(.dropped) > 0)
      warning("getBenthicDatColInds(", codecolumn, "): ", length(.dropped),
              " data column(s) have codes absent from benthicCodes and are DROPPED: ",
              paste(.dropped, collapse = ", "), " -- add them to benthicCodes if they are taxa.")
    return(genusdf)
  }
The function is applied to each program’s benthic dataset, then rows with a missing group are dropped.
tcrmp_columnInds <-
  getBenthicDatColInds(tcrmp_benthicDat, "tcrmp_Code", "tcrmp_Meaning")
vinps_columnInds <-
  getBenthicDatColInds(vinps_benthicDat, "vinps_TaxonCode", "tcrmp_Meaning")
csunrandom_columnInds <-
  getBenthicDatColInds(csun_random_benthicDat, "csun_random_code", "tcrmp_Meaning")

# tcrmp_columnInds <-tcrmp_columnInds[-8,]
# vinps_columnInds <- vinps_columnInds[-c(6,8),]
# csunrandom_columnInds <- csunrandom_columnInds[7,]
# csunrandom_columnInds$colinds <- 8

tcrmp_columnInds <- tcrmp_columnInds |>
  filter(!is.na(tcrmp_columnInds$group))
vinps_columnInds <- vinps_columnInds |>
  filter(!is.na(vinps_columnInds$group))
csunrandom_columnInds <- csunrandom_columnInds |>
  filter(!is.na(csunrandom_columnInds$group))
# csunrandom_columnInds <- csunrandom_columnInds[7,]Table 1 previews the TCRMP column-index map, one row per algal group with the benthic-data columns that fall into it. The UAGA guard inside getBenthicDatColInds() warns if any program’s data column has a code absent from benthicCodes, so a taxon cannot be silently dropped.
kbl(tcrmp_columnInds) |>
  kable_paper(full_width = F) |>
  kable_styling(
    fixed_thead = T,
    bootstrap_options = c("hover", "condensed"),
    font_size = 8
  ) |>
scroll_box(width = "100%", height = "250px")| group | colinds |
|---|---|
| Dictyota spp. | 95 |
| Halimeda spp. | 96 |
| Lobophora spp. | 98 |
| Amphiroa spp. | 92 |
| Filamentous cyanobacteria | 104 |
| Lyngbia spp. | 105 |
| Schizothrix spp. | 106 |
| Liagora spp. | 97 |
| Macroalgae | 99 |
| Cladophora spp. | 94 |
| Microdictyon spp. | 100 |
| Peyssonneliaceae (includes Peyssonellia spp., Ramicrusta spp.) | 101, 102 |
| Sargassum spp. | 103 |
makeGroupedBenthicDat()this is the second function that connects benthicDat to benthicCodes for all three programs.
makeGroupedBenthicDat() extracts the column indices (colinds) from each row of *_columnInds.
If only one index in colinds , assigns the corresponding column from benthicdat to the i-th column of a data frame _groupedBenthicDat.
if more than one index in colinds, stores row sum of benthicDat[,colinds] in the i-th column of _groupedBenthicDat.
arguments:
benthicDat is benthic dataset of interest
columnInds is the output of getBenthicDatColInds() above that contains column indices of benthic codes for each benthic subgroup of interest
makeGroupedBenthicDat <- function(benthicDat, columnInds) {
  groupeddat <- data.frame(matrix(nrow = nrow(benthicDat),
                                  ncol = nrow(columnInds)))
  colnames(groupeddat) <- columnInds$group
  benthicDat <- benthicDat %>% dplyr::mutate(dplyr::across(dplyr::where(is.numeric), ~replace(.x, is.na(.x), 0)))
  for (i in 1:nrow(columnInds)) {
    geni <- columnInds[i,]
    datcoli <- unlist(geni$colinds)
    if (length(datcoli) == 1) {
      groupeddat[, i] <- benthicDat[, datcoli]
    } else {
      groupeddat[, i] <- rowSums(benthicDat[, datcoli])
    }
  }
  groupeddat <- cbind(benthicDat[, 1:6], groupeddat)
  return(groupeddat)
}
The function is applied to each program’s benthic dataset and column-index map, producing one grouped cover table per program.
tcrmp_groupedBenthicDat <-
  makeGroupedBenthicDat(tcrmp_benthicDat, tcrmp_columnInds)
vinps_groupedBenthicDat <-
  makeGroupedBenthicDat(vinps_benthicDat, vinps_columnInds)
csun_groupedBenthicDat <-
makeGroupedBenthicDat(csun_random_benthicDat, csunrandom_columnInds)Table 2 shows the first rows of the grouped TCRMP cover table, confirming that the survey metadata columns and one column per algal group carried through the grouping step.
| program | date | site | period | replicate | replicatetype | Dictyota spp. | Halimeda spp. | Lobophora spp. | Amphiroa spp. | Filamentous cyanobacteria | Lyngbia spp. | Schizothrix spp. | Liagora spp. | Macroalgae | Cladophora spp. | Microdictyon spp. | Peyssonneliaceae (includes Peyssonellia spp., Ramicrusta spp.) | Sargassum spp. |
|---|---|---|---|---|---|---|---|---|---|---|---|---|---|---|---|---|---|---|
| TCRMP | 2001-04-25 | Cane Bay | Annual | 1 | transect | 0.38 | 0 | 0.38 | 0 | 0 | 0 | 0 | 0 | 5.36 | 0 | 0 | 0 | 0 |
| TCRMP | 2001-04-25 | Cane Bay | Annual | 2 | transect | 0.78 | 0 | 0.00 | 0 | 0 | 0 | 0 | 0 | 1.95 | 0 | 0 | 0 | 0 |
| TCRMP | 2001-04-25 | Cane Bay | Annual | 3 | transect | 0.39 | 0 | 0.00 | 0 | 0 | 0 | 0 | 0 | 2.71 | 0 | 0 | 0 | 0 |
| TCRMP | 2001-04-25 | Cane Bay | Annual | 4 | transect | 0.36 | 0 | 0.00 | 0 | 0 | 0 | 0 | 0 | 4.35 | 0 | 0 | 0 | 0 |
| TCRMP | 2001-04-25 | Cane Bay | Annual | 5 | transect | 0.39 | 0 | 0.00 | 0 | 0 | 0 | 0 | 0 | 0.00 | 0 | 0 | 0 | 0 |
| TCRMP | 2001-04-25 | Cane Bay | Annual | 6 | transect | 1.88 | 0 | 0.00 | 0 | 0 | 0 | 0 | 0 | 8.65 | 0 | 0 | 0 | 0 |
What happens here: the three per-program grouped cover tables are reconciled to a common set of columns, stacked into one table, tagged with survey year, reshaped to long format, and marked for presence. CSUN carries fewer algal groups than TCRMP and VINPS, so the reconciliation fills the groups a program does not record with NA.
The union of column names across all three tables sets the common column order.
Each program’s missing columns are identified against that union.
The missing columns are added as NA so every table shares the same columns.
for (col in missing_columns_tcrmp) {
  tcrmp_groupedBenthicDat[[col]] <- NA
}
for (col in missing_columns_vinps) {
  vinps_groupedBenthicDat[[col]] <- NA
}
for (col in missing_columns_csung) {
  csun_groupedBenthicDat[[col]] <- NA
}
Columns are reordered to the common order.
tcrmp_groupedBenthicDat <- tcrmp_groupedBenthicDat[, all_columns]
vinps_groupedBenthicDat <- vinps_groupedBenthicDat[, all_columns]
csun_groupedBenthicDat <- csun_groupedBenthicDat[, all_columns]
The three tables are stacked into one groupedBenthicDat.
groupedBenthicDat <-
  rbind(tcrmp_groupedBenthicDat,
        vinps_groupedBenthicDat,
        csun_groupedBenthicDat)
Survey year is added from the date column.
The wide cover table is reshaped to long format, one row per record and algal taxon, and empty cover values are dropped.
A presence column marks whether each algal taxon was present (cover above zero) in a record.
For TCRMP and VINPS, the pipeline averages percent cover across replicate transects at each site and year, so those means carry standard error. CSUN has one transect per site, since only quadrats were collected, so its means carry no error bars.
Total algal cover per site-year is summed across taxa within each transect, then averaged across transects.
totaldatCovSum <- groupedBenthicDat |>
  dplyr::group_by(year, date, program, site, period, replicate) |>
  dplyr::summarise(perccover = sum(perccover))

totaldatCovSum <- totaldatCovSum |>
  dplyr::group_by(year, date, program, site) |>
  dplyr::summarise(
    meancov = mean(perccover),
    sdcov = sd(perccover),
    secov = sd(perccover) / (sqrt(length(perccover))),
    n = length(perccover)
  )

totaldatCovSum <- totaldatCovSum %>% dplyr::mutate(dplyr::across(dplyr::where(is.numeric), ~replace(.x, is.na(.x), 0)))Cover is averaged across transects for each algal taxon at each site and year.
groupedBenthicDatCovSum <- groupedBenthicDat |>
  dplyr::group_by(year, date, program, site, algaeTaxa) |>
  dplyr::summarise(
    meancov = mean(perccover),
    sdcov = sd(perccover),
    secov = sd(perccover) / (sqrt(length(perccover))),
    n = length(perccover)
  )
groupedBenthicDatCovSum <- groupedBenthicDatCovSum %>% dplyr::mutate(dplyr::across(dplyr::where(is.numeric), ~replace(.x, is.na(.x), 0)))Figure 1 stacks the mean cover of each algal taxon over time at every site, ordered shallow to deep, with total algal cover and its standard error drawn as black points and bars. Reading down a facet column and across the years shows how the algal community at a site shifted after the 2005 bleaching event.
#add site info so can plot according to increasing depth
groupedBenthicDatCovSum <-
  merge(groupedBenthicDatCovSum, sitedat, by = "site")
groupedBenthicDatCovSum <-
  groupedBenthicDatCovSum[order(groupedBenthicDatCovSum$depth), ]
groupedBenthicDatCovSum$site <- factor(groupedBenthicDatCovSum$site,
                                       levels = unique(groupedBenthicDatCovSum$site))

#add site info so can plot according to increasing depth
totaldatCovSum <-
  merge(totaldatCovSum, sitedat, by = "site")
totaldatCovSum <-
  totaldatCovSum[order(totaldatCovSum$depth), ]
totaldatCovSum$site <- factor(totaldatCovSum$site,
                              levels = unique(totaldatCovSum$site))

stack <- ggplot() +
  geom_area(data = groupedBenthicDatCovSum,
            aes(x = year, y = meancov, fill = algaeTaxa),
            position = 'stack') +
  # geom_line(data = totaldatCovSum, aes(x=year, y= meancov),color="black")+
  geom_point(
    data = totaldatCovSum,
    aes(x = year, y = meancov),
    color = "black",
    size = 0.5
  ) +
  geom_linerange(
    data = totaldatCovSum,
    aes(
      x = year,
      ymin = meancov - secov,
      ymax = meancov + secov
    ),
    color = "black",
    linewidth = 0.5
  ) +
  facet_wrap( ~ site, scales = "free_x") +
  ylab("percent cover") +
  scale_y_continuous(expand = c(0, 0)) +
  scale_x_continuous(
    expand = expansion(mult = 0.04),
    breaks = seq(minyear, maxyear, by = 1),
    labels = function(x)
        ifelse(x %% 5 == 0, paste0("'", substr(x, 3, 4)), "")
    ) +
  geom_vline(
    xintercept = 2005,
    color = "gray50",
    alpha = 0.5,
    lty = "dashed"
  ) +
  theme_bw() +
  theme(strip.text = element_text(size = 10)) +
  theme(legend.position = "bottom") +
  theme(panel.grid.major = element_blank(),
        panel.grid.minor = element_blank()) +
  theme(legend.direction = "horizontal")

stack

# svg(filename="algaecover.svg", width = 15, height =15)
# stack +   theme(legend.direction = "horizontal")
# dev.off()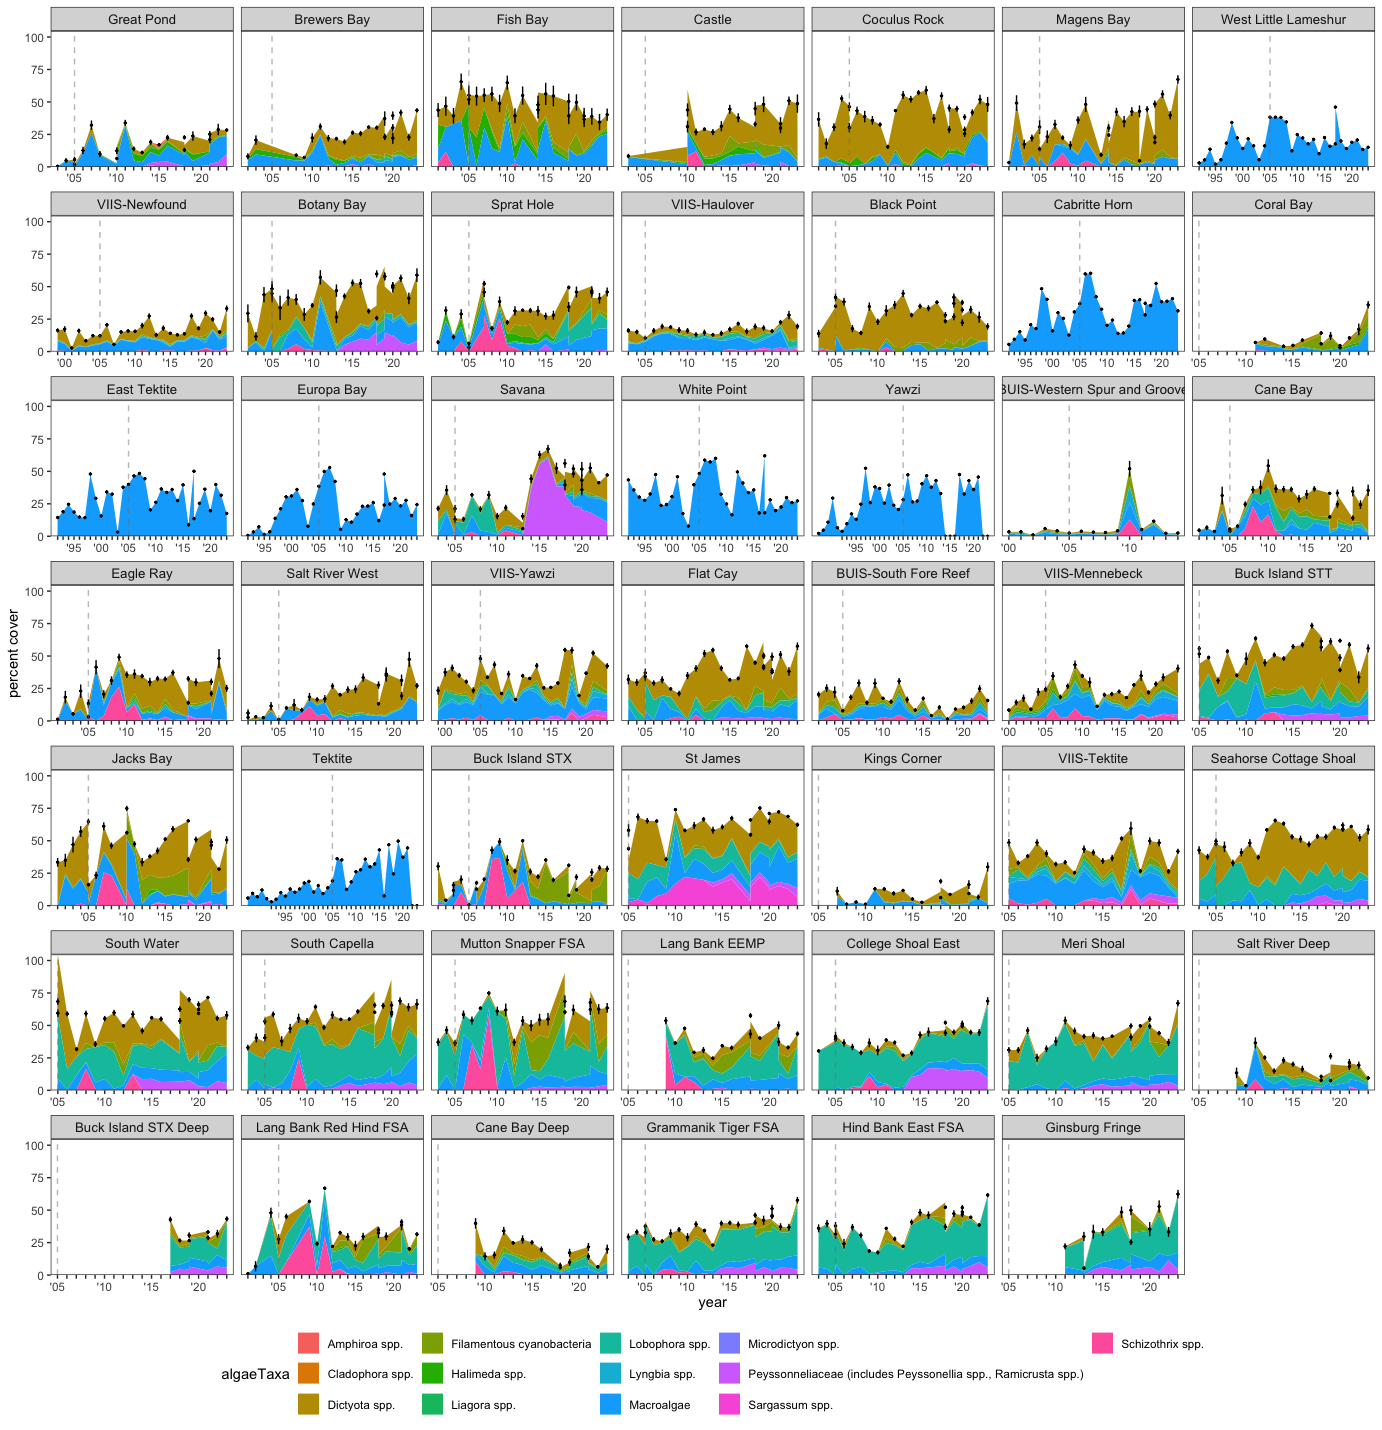
Macroalgae and fleshy cyanobacteria are tracked at every site across the three programs, so Figure 1 shows both the site-to-site range in algal cover and the shifts that follow the 2005 bleaching event. The stacked bands separate the algal groups within each site’s total cover, and the black points with standard error give the total algal cover trajectory at the TCRMP and VINPS sites.
The links below provide this page’s derived algal cover data table, its metadata, and the page’s .qmd source.
version 1.0.0 • in-review • data ≤ 2023