Show code
sitedat <-
  read.csv(
    "../../../RRSdata/00_RRS_dataCatalogStatus/00_RRS_siteMaster_allSites_data.csv"
)This page computes the straight-line distance from each USVI Reef Resilience Survey site to the nearest populated island shoreline. We pair the site latitude and longitude from the master site catalog with USGS coastline shapefiles, find the closest shoreline point for every site with geosphere::dist2Line, map the sites and their nearest-shoreline connectors, and report summary statistics and a histogram. The page produces siteDistFromShore (program, site, distance from shore) plus its metadata, a single static per-site attribute suitable as a candidate covariate for reef community and driver analyses. This attribute is a static site characteristic rather than a program time series, so no TCRMP, VINPS, or CSUN temporal trend appears here.
This page reads site coordinates from the RRS master site catalog, drawn from the TCRMP, VINPS, and CSUN monitoring programs, and it reads USGS coastline shapefiles (one filtered to inhabited islands for the distance calculation, one with all US Caribbean islands for plotting). The derived per-site distance table produced here is available in the Downloads section below.
We load the master catalog of USVI RRS sites into sitedat. It carries the site latitudes and longitudes we use to find the closest point on the nearest shoreline.
sitedat <-
read.csv(
"../../../RRSdata/00_RRS_dataCatalogStatus/00_RRS_siteMaster_allSites_data.csv"
)We read two coastline shapefiles from USGS basemaps:
my_shapefile: the large, inhabited islands of the USVI only. We use this shapefile for the distance calculations, so distances are measured to inhabited-island shorelines and not to small, uninhabited keys.
my_shapefile_whole: all islands in the US Caribbean. We use this shapefile for plotting.
We plot the filtered coastline in Figure 1 to confirm it holds only the inhabited islands used for the distance calculation.
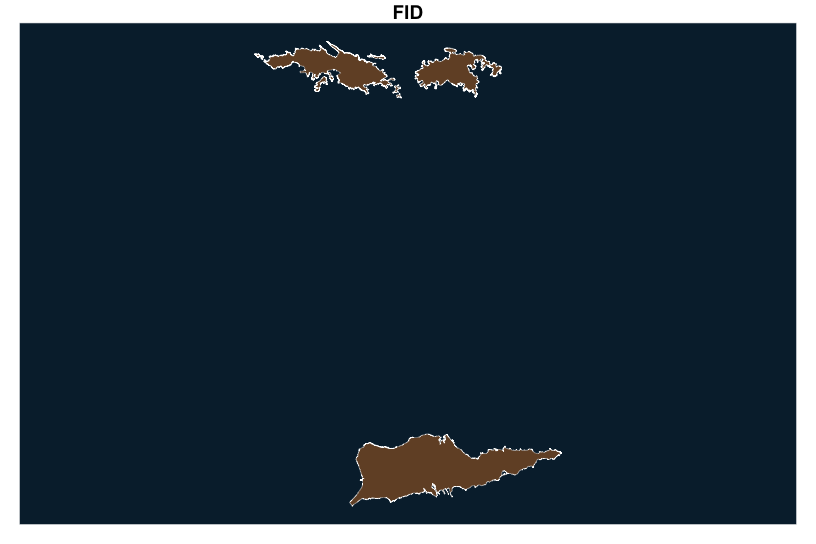
my_shapefile) used for the distance-from-shore calculation. Small uninhabited keys are excluded so distances are measured to inhabited shorelines.
We build spatial points from the site longitudes and latitudes in sitedat.
pts <- data.frame(x1 = sitedat$lon, y1 = sitedat$lat)
spts <- SpatialPoints(list(x = pts$x1, y = pts$y1))
We compute the shortest distance between each site point and the inhabited-island polygons with geosphere::dist2Line. It returns, for each site, the distance in meters, the longitude and latitude of the nearest shoreline point, and the index of the nearest polygon.
Validation note: dist.mat returns 50 rows (one per site) with columns distance, lon, lat, ID. Distances span 9 to 18003 m.
We bind the distance results back to the original site points.
pts.wit.dist <- cbind(pts, dist.mat)Validation note: pts.wit.dist carries 50 rows with columns x1, y1, distance, lon, lat, ID, pairing each site’s coordinates (x1, y1) with its computed distance and nearest-shoreline point.
We then attach the distance to sitedat for the map and summary below.
sitedat$dist_from_shore <- pts.wit.dist$distance
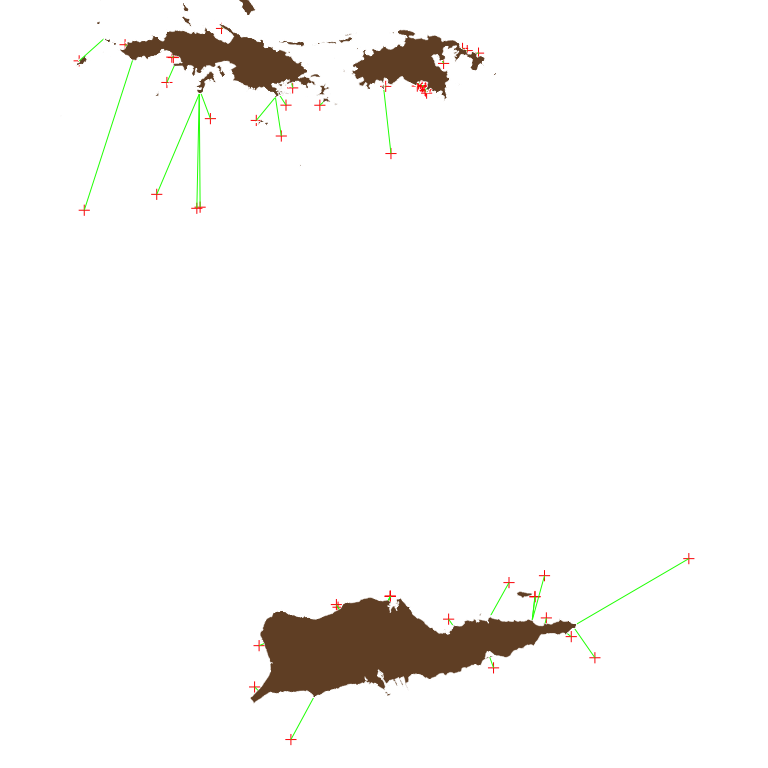
# write.csv(sitedat, paste("output/RRS_SiteMasterWithDistances_",Sys.Date(),".csv",sep=""))Figure 2 maps every site (red) over the full Caribbean coastline and draws a green connector from each site to its nearest inhabited-island shoreline point. It shows which sites sit close to shore and which reach across open water, and confirms the connectors point to inhabited islands rather than nearby keys.
par(mar = c(0, 0, 0, 0))

plot(spts, col = "red")

plot(
  my_shapefile_whole,
  col = "#734f30",
  bg = "#062639",
  lwd = 0.25,
  border = 0,
  add = TRUE
)

for (i in 1:nrow(pts.wit.dist)) {
  arrows(
    x0 = pts.wit.dist[i, 1],
    y0 = pts.wit.dist[i, 2],
    x1 = pts.wit.dist[i, 4],
    y1 = pts.wit.dist[i, 5],
    length = 0,
    col = "green",
    bg = "#062639"
  )
}
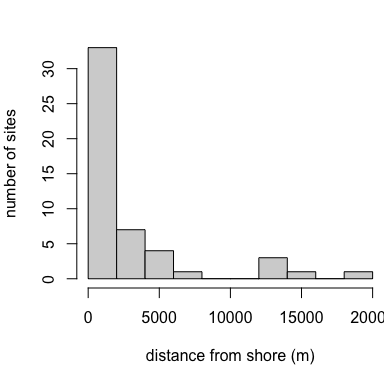
Distances from shore ranged from 9 m (East Tektite) to 18003 m (College Shoal East), with a median of 525 m.
Table 1 reports the central tendency and spread of site distances from shore.
knitr::kable(summary_table, format = "markdown")| Statistics | Value |
|---|---|
| Mean Distance | 2600 |
| Median Distance | 525 |
| 25th Percentile | 132 |
| 75th Percentile | 3267 |
Figure 3 shows how site distances from shore are distributed across all sites.
The site distance-from-shore table and its metadata are available below.
version 1.0.0 • in-review • data ≤ 2023-12-31