Show code
sitedat <- read.csv("../../../RRSdata/00_RRS_dataCatalogStatus/00_RRS_siteMaster_allSites_data.csv")This page derives coral resilience metrics from coral-genera percent cover across all sites and years. It computes absolute coral cover, coral cover relative to pre-disturbance values, relative recovery from the start of the recovery interval, and the diversity of coral genera as an inverse Simpson index. These metrics guide the multivariate analyses in section 5.2 and the choice of response variables in later analyses.
This page draws on the reef monitoring programs described on the Data Sources page: TCRMP, VINPS, and CSUN. It reads the site master table and the derived coral-genera percent cover product (s2pt4). The resilience metrics computed here are saved to a workspace and offered for download in the next section (see Downloads below).
import sitedat
sitedat <- read.csv("../../../RRSdata/00_RRS_dataCatalogStatus/00_RRS_siteMaster_allSites_data.csv")import coralcover
# file_coralcover <- "s2pt3_benthicCoverMajorBenthicCategories_35sites_2003_2022"
file_coralcover <- latest_output("s2pt4_benthicCoverCoralGenera")

data_coralcover <- read.csv(paste("../../outputs/",file_coralcover,".csv",sep=""))
metadata_coralcover <- readLines(paste("../../outputs/",file_coralcover,".txt",sep=""))
metadata
###############################
filename: s2pt4_benthicCoverCoralGenera_49sites_1987_2023.csv
date: 2026-07-06 01:33:05.158472
description: aggregated surveyed coral species by genera and annual percent cover at 35 sites. The idea to use coral genera is based on coral genera groupings in `csun_random_benthicDat` , resilience of coral genera scored by @vanwoesik2012 , and analyses of coral genera frequency by @longterm_moritz_2021
###############################

column names:
year program date site period replicate replicatetype coralGenera perccover pres

column: year
description: survey year
Data Type: numeric
Mean: 2012.58813260352
Min: 1987
Max: 2023

column: program
description: monitoring program
Data Type: character
Unique Values: (showing all 3 entries)
   TCRMP
   VINPS
   CSUN

column: date
description: date of survey
Data Type: Date
Date Range: 1987-06-01 to 2023-12-07

column: site
description: survey site
Data Type: character
Unique Values: (showing all 49 entries)
   Cane Bay
   Eagle Ray
   Lang Bank Red Hind FSA
   Jacks Bay
   Buck Island STX
   Salt River West
   Coculus Rock
   Magens Bay
   Sprat Hole
   Fish Bay
   Brewers Bay
   Botany Bay
   Hind Bank East FSA
   Castle
   Grammanik Tiger FSA
   College Shoal East
   Mutton Snapper FSA
   Flat Cay
   Seahorse Cottage Shoal
   Great Pond
   Black Point
   Savana
   South Capella
   Buck Island STT
   South Water
   St James
   Meri Shoal
   Kings Corner
   Salt River Deep
   Lang Bank EEMP
   Cane Bay Deep
   Ginsburg Fringe
   Coral Bay
   Buck Island STX Deep
   VIIS-Newfound
   VIIS-Yawzi
   VIIS-Mennebeck
   VIIS-Haulover
   VIIS-Tektite
   BUIS-Western Spur and Groove
   BUIS-South Fore Reef
   Cabritte Horn
   East Tektite
   Europa Bay
   West Little Lameshur
   West Tektite
   White Point
   Yawzi
   Tektite

column: period
description: monitoring period
Data Type: character
Unique Values: (showing all 6 entries)
   Annual
   PeakBL
   WS
   SCTLD
   PostBL
   NA

column: replicate
description: replicate number/identifier
Data Type: character
Unique Values: (showing all 20 entries)
   1
   2
   3
   4
   5
   6
   7
   8
   9
   10
   11
   12
   13
   14
   15
   16
   17
   18
   19
   20

column: replicatetype
description: type of replicate
Data Type: character
Unique Values: (showing all 2 entries)
   transect
   site

column: coralGenera
description: coral genus
Data Type: character
Unique Values: (showing all 29 entries)
   Millepora
   Dendrogyra
   Acropora
   Orbicella
   Scolymia
   Porites
   Mycetophyllia
   Mussa
   Madracis
   Isopyhyllastrea
   unknown
   unknown juv.
   Helioseris
   Oculina
   Solenastrea
   Tubastraea
   Stephanocoenia
   Siderastrea
   Montastraea
   Meandrina
   Favia
   Eusmilia
   Diploria
   Dichocoenia
   Colpophyllia
   Pseudodiploria
   Manicina
   Agaricia
   Isophyllia

column: perccover
description: percentage cover of that coral genus
Data Type: numeric
Mean: 0.414024306680286
Min: 0
Max: 74.23

column: pres
description: presence/absence of that coral genus
Data Type: numeric
Mean: 0.160589914713281
Min: 0
Max: 1
Explore the complete coral-genera percent-cover dataset used in this section. The plot shows mean percent cover through time for the most abundant genera; the table is the entire dataset, searchable and filterable by any column.
Table shows a random sample of 15,000 of 219,964 rows. The plot above uses every row.
site/year replication
| site | 2002 | 2003 | 2004 | 2005 | 2006 | 2007 | 2008 | 2009 | 2010 | 2011 | 2012 | 2013 | 2014 | 2015 | 2016 | 2017 | 2018 | 2019 | 2020 | 2021 | 2022 | 2023 | 2000 | 2001 | 1992 | 1993 | 1994 | 1995 | 1996 | 1997 | 1998 | 1999 | 1987 | 1988 | 1989 | 1990 | 1991 |
|---|---|---|---|---|---|---|---|---|---|---|---|---|---|---|---|---|---|---|---|---|---|---|---|---|---|---|---|---|---|---|---|---|---|---|---|---|---|
| BUIS-South Fore Reef | 20 | 20 | 20 | 20 | 20 | 20 | 20 | 20 | 20 | 20 | 20 | 20 | 20 | 20 | 20 | 20 | 20 | 20 | 20 | 20 | 20 | 20 | NA | NA | NA | NA | NA | NA | NA | NA | NA | NA | NA | NA | NA | NA | NA |
| BUIS-Western Spur and Groove | 19 | 20 | 20 | 20 | 20 | 20 | 20 | 20 | 20 | 20 | 20 | 20 | 20 | NA | NA | NA | NA | NA | NA | NA | NA | NA | 19 | 19 | NA | NA | NA | NA | NA | NA | NA | NA | NA | NA | NA | NA | NA |
| Black Point | NA | 6 | NA | 6 | 6 | 6 | 6 | 6 | 6 | 6 | 6 | 6 | 6 | 6 | 6 | 6 | 6 | 6 | 6 | 6 | 6 | 6 | NA | NA | NA | NA | NA | NA | NA | NA | NA | NA | NA | NA | NA | NA | NA |
| Botany Bay | 6 | 6 | 6 | 6 | 6 | 6 | 6 | 6 | 6 | 5 | NA | 6 | 6 | 6 | 6 | 6 | 6 | 6 | 6 | 6 | 6 | 6 | NA | NA | NA | NA | NA | NA | NA | NA | NA | NA | NA | NA | NA | NA | NA |
| Brewers Bay | 6 | 6 | NA | NA | NA | NA | 6 | 6 | 6 | 6 | 6 | 6 | 6 | 6 | 6 | 6 | 6 | 6 | 6 | 6 | 6 | 6 | NA | NA | NA | NA | NA | NA | NA | NA | NA | NA | NA | NA | NA | NA | NA |
| Buck Island STT | NA | NA | NA | 6 | 6 | 6 | 6 | 6 | 6 | 6 | 6 | 6 | 6 | 6 | 6 | 6 | 6 | 6 | 6 | 6 | 6 | 6 | NA | NA | NA | NA | NA | NA | NA | NA | NA | NA | NA | NA | NA | NA | NA |
| Buck Island STX | 3 | 6 | 6 | 6 | 6 | 6 | 6 | 6 | 6 | 6 | 6 | 6 | 6 | 6 | 6 | NA | 6 | 6 | NA | 6 | 6 | 6 | NA | 3 | NA | NA | NA | NA | NA | NA | NA | NA | NA | NA | NA | NA | NA |
| Buck Island STX Deep | NA | NA | NA | NA | NA | NA | NA | NA | NA | NA | NA | NA | NA | NA | NA | 6 | 6 | 6 | NA | 6 | 6 | 6 | NA | NA | NA | NA | NA | NA | NA | NA | NA | NA | NA | NA | NA | NA | NA |
| Cabritte Horn | 1 | 1 | 1 | 1 | 1 | 1 | 1 | 1 | 1 | 1 | 1 | 1 | 1 | 1 | 1 | 1 | 1 | 1 | 1 | 1 | 1 | 1 | 1 | 1 | 1 | 1 | 1 | 1 | 1 | 1 | 1 | 1 | NA | NA | NA | NA | NA |
| Cane Bay | 6 | 6 | 6 | 6 | 6 | 6 | 6 | 6 | 6 | 6 | 6 | 6 | 6 | 6 | 6 | NA | 6 | 6 | NA | 6 | 6 | 6 | NA | 6 | NA | NA | NA | NA | NA | NA | NA | NA | NA | NA | NA | NA | NA |
| Cane Bay Deep | NA | NA | NA | NA | NA | NA | NA | 6 | 6 | 6 | 6 | 6 | 6 | 6 | 6 | NA | 6 | 6 | NA | 6 | 6 | 6 | NA | NA | NA | NA | NA | NA | NA | NA | NA | NA | NA | NA | NA | NA | NA |
| Castle | NA | 6 | NA | NA | NA | NA | NA | NA | 6 | 6 | 6 | 6 | 6 | 6 | 6 | NA | 6 | 6 | NA | 6 | 6 | 6 | NA | NA | NA | NA | NA | NA | NA | NA | NA | NA | NA | NA | NA | NA | NA |
| Coculus Rock | 6 | 6 | 6 | 6 | 6 | 6 | 6 | 6 | 6 | 6 | 6 | 6 | 6 | 6 | 6 | 6 | 6 | 6 | 6 | 6 | 6 | 6 | NA | 6 | NA | NA | NA | NA | NA | NA | NA | NA | NA | NA | NA | NA | NA |
| College Shoal East | NA | 6 | NA | 6 | 6 | 6 | 6 | 6 | 6 | 6 | 6 | 6 | 6 | 6 | 6 | NA | 6 | 6 | 6 | 6 | 5 | 5 | NA | NA | NA | NA | NA | NA | NA | NA | NA | NA | NA | NA | NA | NA | NA |
| Coral Bay | NA | NA | NA | NA | NA | NA | NA | NA | NA | 6 | 6 | NA | 6 | 6 | 6 | NA | 6 | 6 | 6 | 6 | 6 | 6 | NA | NA | NA | NA | NA | NA | NA | NA | NA | NA | NA | NA | NA | NA | NA |
| Eagle Ray | 6 | 6 | 6 | 6 | 6 | 6 | 6 | 6 | 6 | 6 | 6 | 6 | 6 | 6 | 6 | NA | 6 | 6 | NA | 6 | 6 | 6 | NA | 6 | NA | NA | NA | NA | NA | NA | NA | NA | NA | NA | NA | NA | NA |
| East Tektite | 1 | 1 | 1 | 1 | 1 | 1 | 1 | 1 | 1 | 1 | 1 | 1 | 1 | 1 | 1 | 1 | 1 | 1 | 1 | 1 | 1 | 1 | 1 | 1 | 1 | 1 | 1 | 1 | 1 | 1 | 1 | 1 | NA | NA | NA | NA | NA |
| Europa Bay | 1 | 1 | 1 | 1 | 1 | 1 | 1 | 1 | 1 | 1 | 1 | 1 | 1 | 1 | 1 | 1 | 1 | 1 | 1 | 1 | 1 | 1 | 1 | 1 | 1 | 1 | 1 | 1 | 1 | 1 | 1 | 1 | NA | NA | NA | NA | NA |
| Fish Bay | 6 | 6 | 6 | 6 | 6 | 6 | 6 | 6 | 6 | 6 | 6 | NA | 6 | 6 | 6 | NA | 6 | 6 | 6 | 6 | 6 | 6 | NA | 6 | NA | NA | NA | NA | NA | NA | NA | NA | NA | NA | NA | NA | NA |
| Flat Cay | NA | 6 | 6 | 6 | 6 | 6 | 6 | 6 | 6 | 6 | 6 | 6 | 6 | 6 | 6 | 6 | 6 | 6 | 6 | 6 | 6 | 6 | NA | NA | NA | NA | NA | NA | NA | NA | NA | NA | NA | NA | NA | NA | NA |
| Ginsburg Fringe | NA | NA | NA | NA | NA | NA | NA | NA | NA | 6 | NA | 6 | 6 | 6 | NA | 6 | 6 | NA | 6 | 6 | 6 | 6 | NA | NA | NA | NA | NA | NA | NA | NA | NA | NA | NA | NA | NA | NA | NA |
| Grammanik Tiger FSA | NA | 6 | 10 | 6 | 6 | 6 | 6 | 6 | 6 | 6 | 6 | 6 | 6 | 6 | 6 | NA | 6 | 6 | 6 | 6 | 6 | 6 | NA | NA | NA | NA | NA | NA | NA | NA | NA | NA | NA | NA | NA | NA | NA |
| Great Pond | NA | 6 | 6 | 6 | 6 | 6 | 6 | NA | 6 | 6 | 6 | 6 | 6 | 6 | 6 | NA | 6 | 6 | NA | 6 | 6 | 6 | NA | NA | NA | NA | NA | NA | NA | NA | NA | NA | NA | NA | NA | NA | NA |
| Hind Bank East FSA | NA | 6 | 10 | 6 | 6 | 6 | 6 | 6 | 6 | 6 | 6 | 6 | 6 | 6 | 6 | NA | 6 | 6 | 6 | 6 | 6 | 6 | NA | NA | NA | NA | NA | NA | NA | NA | NA | NA | NA | NA | NA | NA | NA |
| Jacks Bay | 6 | 6 | 6 | 6 | 6 | 6 | 6 | NA | 6 | 6 | 6 | 6 | 6 | 6 | 6 | NA | 6 | 6 | NA | 6 | 6 | 6 | NA | 6 | NA | NA | NA | NA | NA | NA | NA | NA | NA | NA | NA | NA | NA |
| Kings Corner | NA | NA | NA | NA | NA | 6 | 6 | 6 | 6 | 6 | 6 | 6 | 6 | 6 | 6 | NA | 6 | 6 | NA | 6 | 6 | 6 | NA | NA | NA | NA | NA | NA | NA | NA | NA | NA | NA | NA | NA | NA | NA |
| Lang Bank EEMP | NA | NA | NA | NA | NA | NA | NA | 6 | 6 | 6 | 6 | 6 | 6 | 6 | 6 | NA | 6 | 6 | NA | 6 | 6 | 6 | NA | NA | NA | NA | NA | NA | NA | NA | NA | NA | NA | NA | NA | NA | NA |
| Lang Bank Red Hind FSA | 5 | NA | 6 | 4 | 6 | NA | NA | 6 | 6 | 6 | 6 | 6 | 6 | 6 | 6 | NA | 6 | 6 | NA | 6 | 6 | 6 | NA | 6 | NA | NA | NA | NA | NA | NA | NA | NA | NA | NA | NA | NA | NA |
| Magens Bay | 6 | 6 | 6 | 6 | 5 | 6 | 6 | 6 | 6 | 6 | NA | 6 | 6 | 6 | 6 | 6 | 6 | 6 | 6 | 6 | 6 | 6 | NA | 6 | NA | NA | NA | NA | NA | NA | NA | NA | NA | NA | NA | NA | NA |
| Meri Shoal | NA | NA | NA | 6 | 6 | 6 | 5 | 6 | 6 | 6 | 6 | 6 | 6 | 6 | 6 | NA | 6 | 6 | 6 | 6 | 6 | 6 | NA | NA | NA | NA | NA | NA | NA | NA | NA | NA | NA | NA | NA | NA | NA |
| Mutton Snapper FSA | NA | 6 | 6 | 6 | 6 | 6 | 6 | 6 | 6 | 5 | 6 | 6 | 6 | 6 | 6 | NA | 6 | 6 | NA | 6 | 6 | 6 | NA | NA | NA | NA | NA | NA | NA | NA | NA | NA | NA | NA | NA | NA | NA |
| Neptunes Table | NA | NA | NA | NA | NA | NA | NA | NA | NA | NA | NA | NA | NA | NA | NA | NA | NA | NA | NA | NA | NA | NA | NA | NA | NA | NA | NA | NA | NA | NA | NA | NA | NA | NA | NA | NA | NA |
| SARI-Salt River | NA | NA | NA | NA | NA | NA | NA | NA | NA | NA | NA | NA | NA | NA | NA | NA | NA | NA | NA | NA | NA | NA | NA | NA | NA | NA | NA | NA | NA | NA | NA | NA | NA | NA | NA | NA | NA |
| Salt River Deep | NA | NA | NA | NA | NA | NA | NA | 6 | 6 | 5 | 6 | 6 | 6 | 6 | 6 | NA | 6 | 6 | NA | 6 | 6 | 6 | NA | NA | NA | NA | NA | NA | NA | NA | NA | NA | NA | NA | NA | NA | NA |
| Salt River West | 6 | 6 | 6 | 6 | 6 | 6 | 6 | 6 | 6 | 6 | 6 | 6 | 6 | 6 | 6 | NA | 6 | 6 | NA | 6 | 6 | 6 | NA | 6 | NA | NA | NA | NA | NA | NA | NA | NA | NA | NA | NA | NA | NA |
| Savana | NA | 6 | 6 | 6 | 6 | 6 | 6 | 6 | 6 | 6 | NA | 6 | 6 | 6 | 6 | 6 | 6 | 6 | 6 | 6 | 6 | 6 | NA | NA | NA | NA | NA | NA | NA | NA | NA | NA | NA | NA | NA | NA | NA |
| Seahorse Cottage Shoal | NA | 6 | 10 | 6 | 6 | 6 | 6 | 6 | 6 | 6 | 6 | 6 | 6 | 6 | 6 | 6 | 6 | 6 | 6 | 6 | 6 | 6 | NA | NA | NA | NA | NA | NA | NA | NA | NA | NA | NA | NA | NA | NA | NA |
| South Capella | NA | 6 | 10 | 6 | 6 | 6 | 6 | 6 | 6 | 6 | 6 | 6 | 6 | 6 | 6 | NA | 6 | 6 | 6 | 6 | 6 | 6 | NA | NA | NA | NA | NA | NA | NA | NA | NA | NA | NA | NA | NA | NA | NA |
| South Water | NA | NA | NA | 6 | 6 | 6 | 6 | 6 | 6 | 6 | 6 | 6 | 6 | 6 | 6 | NA | 6 | 6 | 6 | 6 | 6 | 6 | NA | NA | NA | NA | NA | NA | NA | NA | NA | NA | NA | NA | NA | NA | NA |
| Sprat Hole | 5 | 6 | 6 | 6 | NA | 6 | 6 | 6 | 6 | 6 | 6 | 6 | 6 | 6 | 6 | NA | 6 | 6 | NA | 6 | 6 | 6 | NA | 6 | NA | NA | NA | NA | NA | NA | NA | NA | NA | NA | NA | NA | NA |
| St James | NA | NA | NA | 6 | 6 | 6 | 6 | 6 | 6 | 6 | 6 | 6 | 6 | 6 | 6 | NA | 6 | 6 | 6 | 6 | 6 | 6 | NA | NA | NA | NA | NA | NA | NA | NA | NA | NA | NA | NA | NA | NA | NA |
| Tektite | 1 | 1 | 1 | 1 | 1 | 1 | 1 | 1 | 1 | 1 | 1 | 1 | 1 | 1 | 1 | 1 | 1 | 1 | 1 | 1 | 1 | 1 | 1 | 1 | 1 | 1 | 1 | 1 | 1 | 1 | 1 | 1 | 1 | 1 | 1 | 1 | 1 |
| VIIS-Haulover | NA | 20 | 20 | 20 | 20 | 20 | 20 | 20 | 20 | 20 | 20 | 20 | 20 | 20 | 20 | 20 | 20 | 20 | 20 | 20 | 20 | 20 | NA | NA | NA | NA | NA | NA | NA | NA | NA | NA | NA | NA | NA | NA | NA |
| VIIS-Mennebeck | 20 | 20 | 20 | 20 | 20 | 20 | 20 | 20 | 20 | 20 | 20 | 20 | 20 | 20 | 20 | 19 | 20 | 20 | 20 | 20 | NA | 20 | 20 | 20 | NA | NA | NA | NA | NA | NA | NA | NA | NA | NA | NA | NA | NA |
| VIIS-Newfound | 20 | 20 | 20 | 20 | 20 | 20 | 20 | 20 | 20 | 20 | 20 | 20 | 20 | 20 | 20 | 20 | 20 | 20 | 20 | 20 | 20 | 20 | 20 | 20 | NA | NA | NA | NA | NA | NA | NA | 20 | NA | NA | NA | NA | NA |
| VIIS-Tektite | NA | NA | NA | 20 | 20 | 20 | 20 | 20 | 20 | 20 | 20 | 20 | 20 | 20 | 20 | 20 | 20 | 20 | 20 | 20 | 20 | 20 | NA | NA | NA | NA | NA | NA | NA | NA | NA | NA | NA | NA | NA | NA | NA |
| VIIS-Yawzi | 20 | 20 | 20 | 20 | 20 | 20 | 20 | 20 | 20 | 20 | 20 | 20 | 20 | 20 | 20 | 20 | 20 | 20 | 20 | 20 | NA | 20 | 20 | 20 | NA | NA | NA | NA | NA | NA | NA | 20 | NA | NA | NA | NA | NA |
| West Little Lameshur | 1 | 1 | 1 | 1 | 1 | 1 | 1 | 1 | 1 | 1 | 1 | 1 | 1 | 1 | 1 | 1 | 1 | 1 | 1 | 1 | 1 | 1 | 1 | 1 | 1 | 1 | 1 | 1 | 1 | 1 | 1 | 1 | NA | NA | NA | NA | NA |
| West Tektite | 1 | 1 | 1 | 1 | 1 | 1 | 1 | 1 | 1 | 1 | 1 | 1 | 1 | 1 | 1 | 1 | 1 | 1 | 1 | 1 | 1 | 1 | 1 | 1 | 1 | 1 | 1 | 1 | 1 | 1 | 1 | 1 | NA | NA | NA | NA | NA |
| White Point | 1 | 1 | 1 | 1 | 1 | 1 | 1 | 1 | 1 | 1 | 1 | 1 | 1 | 1 | 1 | 1 | 1 | 1 | 1 | 1 | 1 | 1 | 1 | 1 | 1 | 1 | 1 | 1 | 1 | 1 | 1 | 1 | NA | NA | NA | NA | NA |
| Yawzi | 1 | 1 | 1 | 1 | 1 | 1 | 1 | 1 | 1 | 1 | 1 | 1 | 1 | 1 | 1 | 1 | 1 | 1 | 1 | 1 | 1 | 1 | 1 | 1 | 1 | 1 | 1 | 1 | 1 | 1 | 1 | 1 | 1 | 1 | 1 | 1 | 1 |
# 1: Group the data by 'program', 'site', 'replicate', 'year', and 'date'
# 2: Calculate the sum of 'perccover' for each group
# 3: Create a new column 'coralcover_date' and set it equal to the 'date' column
# 4: Remove the 'date' column from the dataset
# 5: Ungroup the dataset, removing the grouping structure
mod_coralcover <- data_coralcover |>
  group_by(program, site, replicate, year, date) |>
  summarise(coralcover = sum(perccover)) |>
  mutate(coralcover_date = date) |>
  select(-date) |>
ungroup()want to scale coral cover relative to pre-disturbance values (2003-2005)
the equation
\[\frac{{\text{coral cover post-disturbance} - \text{coral cover pre-disturbance}}}{{\text{coral cover pre-disturbance}}}\]
In the context of measuring reef recovery represents the relative change in coral cover over the period of a disturbance event, expressed as a fraction or percentage of the original (pre-disturbance) coral cover.
A positive value indicates that the coral cover post-disturbance is greater than the coral cover pre-disturbance, meaning there has been an increase in coral cover.
A negative value indicates that the coral cover post-disturbance is less than the coral cover pre-disturbance, implying a loss in coral cover.
Interpretation
“Moreover, the slowing of recovery usually indicates that a system is deteriorating and may be approaching a critical threshold, beyond which the system switches to an alternate and often undesirable state19,20. Indeed,understanding the rates of change and the resilience of systems has become central to our understanding of modern ecology21,22” Woesik et al. (2018)
# 1: Create 'mod_coralcover_predist' dataset
# 2: Filter the data to include only records for the years in predisturbance interval
# 3: Group the data by 'program', 'site', 'replicate', 'year', and 'date'
# 4: Calculate the sum of 'perccover' for each group
# 5: Ungroup the dataset, removing the grouping structure
# 6: Group the data again by 'program', 'site', and 'replicate'
# 7: Calculate the mean 'coralcover' for the years predist
# 8: Ungroup the dataset, removing the grouping structure

mod_coralcover_predist <- data_coralcover |>
  # filter(site %in% sitetokeep) |>
  filter(date < "2005-08-01") |>
  # filter(year %in% c(2003, 2004, 2005)) |>
  group_by(program, site, replicate, year, date) |>
  summarise(coralcover = sum(perccover)) |>
  ungroup() |>
  group_by(program, site, replicate) |>
  summarise(coralCoverPreDisturbance = mean(coralcover)) |>
  ungroup()

# 1: Create 'mod_coralcover_relative' dataset:
# 2: Filter the data to include only records within a specified year range
# 3: Group the data by 'program', 'site', 'replicate', 'year', and 'date'
# 4: Calculate the sum of 'perccover' for each group
# 5: Create a new column 'coralcover_date' and set it equal to the 'date' column
# 6: Remove the 'date' column from the dataset
# 7: Left join with 'mod_coralcover_predist' dataset using 'site' and 'replicate' as the join keys
# 8: Ungroup the dataset, removing the grouping structure
# 9: Calculate 'coralcover_relative' by subtracting 'coralCoverPreDisturbance' and dividing by 'coralCoverPreDisturbance'
mod_coralcover_relative <- data_coralcover |>
  # filter(site %in% sitetokeep) |>
  filter(year >= set_minyear & year <= set_maxyear) |>
  group_by(program, site, replicate, year, date) |>
  summarise(coralcover = sum(perccover)) |>
  mutate(coralcover_date = date) |>
  select(-date) |>
  left_join(
    mod_coralcover_predist |> select(site, replicate, coralCoverPreDisturbance),
    by = c("site", "replicate")
  ) |>
  ungroup() |>
  mutate(coralcover_relative = ((coralcover - coralCoverPreDisturbance) / coralCoverPreDisturbance
  ))
make mod
mod <- mod_coralcover_relativewant to scale coral cover relative to the year that recovery started (2007)
the equation
\[\frac{{\text{coral cover post-disturbance} - \text{coral cover at beginning of recovery interval}}}{{\text{coral cover at beginning of recovery interval}}}\]
mod_coralcover_beginningRecovery <- data_coralcover |>
  # filter(site %in% sitetokeep) |>
  filter(year == toString(recovery_interval[1])) |>
  # filter(year %in% c(2003, 2004, 2005)) |>
  group_by(program, site, replicate, year, date) |>
  summarise(coralcover = sum(perccover)) |>
  ungroup() |>
  group_by(program, site, replicate) |>
  summarise(coralCoverRecoveryStart = mean(coralcover)) |>
  ungroup()

mod_coralcover_relativeRecovery <- data_coralcover |>
  # filter(site %in% sitetokeep) |>
  filter(year >= recovery_interval[1] & year <= recovery_interval[2]) |>
  group_by(program, site, replicate, year, date) |>
  summarise(coralcover = sum(perccover)) |>
  mutate(coralcover_date = date) |>
  select(-date) |>
  left_join(
    mod_coralcover_beginningRecovery |> select(site, replicate, coralCoverRecoveryStart),
    by = c("site", "replicate")
  ) |>
  ungroup() |>
  mutate(coralcover_relative = ((coralcover - coralCoverRecoveryStart) / coralCoverRecoveryStart
  ))
make mod
mod <- mod_coralcover_relativeRecoveryThe Inverse Simpson Diversity Index is calculated for each combination of year, site, and replicate. This index provides insights into the diversity of coral genera observed during each survey, with higher values indicating greater diversity.
the Simpson Diversity Index (\(D\)):
\[D = \sum_{i=1}^{S} p_i^2\]
where:
\(p_i\) would be the proportion of each coralGenera in each year, site, and replicate, which can be calculated as the perccover of that coralGenera divided by the total perccover for that group.
\(S\) would be the number of unique coralGenera in that group.
This index calculates the probability that two randomly selected individuals (here, points) from the dataset will belong to the same species. A higher value of \(D\) implies lower diversity, as it indicates a higher probability of two individuals being of the same species.
And the inverse Simpson Diversity Index is:
\[D_{\text{inv}} = \frac{1}{D}\]
This value will increase as \(D\) decreases, meaning that higher diversity (more equal distribution among species) will result in a higher \(D_{\text{inv}}\). Conversely, lower diversity (one or few species dominating) will result in a lower \(D_{\text{inv}}\).
# 1: Calculate total coral cover for each combination of 'site', 'year', and 'replicate'
# 2: Left join 'simpson_calculation' with the original 'data_coralcover' dataset
# 3: Calculate the proportion of coral cover for each observation
# 4: Group by 'site', 'year', and 'replicate' again
# 5: Calculate the Simpson index for each group
# 6: Calculate Simpson diversity by taking the reciprocal of the Simpson index
# 7: Calculate the mean and standard deviation of Simpson diversity for each combination of 'site' and 'year'
simpson_calculation <- data_coralcover |>
  group_by(site, year, replicate) |>
  summarise(total = sum(perccover))  |>
  left_join(data_coralcover)  |>
  mutate(proportion = perccover / total) |>
  group_by(site, year, replicate)  |>
  summarise(simpson_index = sum(proportion ^ 2))  |>
  mutate(simpson_diversity = 1 / simpson_index)

# Calculate the mean and standard deviation of Simpson diversity for each combination of 'site' and 'year'
simpson_calculation_sum <- simpson_calculation |>
  group_by(site, year) |>
  summarise(meandiv = mean(simpson_diversity),
            sddiv = sd(simpson_diversity))
left join with mod
mod_coralcover_relative <- mod_coralcover_relative |>
  left_join(
    simpson_calculation |> select(site, year, replicate, simpson_diversity),
    by = c("site", "year", "replicate")
)calculating summary df, creating a new ‘status’ column, setting specific values for ‘status’ based on year, joining with another dataset, converting columns to factors, and reordering factor levels.
# 1: Group 'mod_coralcover_relative' dataset by 'site' and 'year'
# 2: Calculate the mean and standard deviation of 'coralcover_relative', 'coralcover', and "simpson_diversity' for each group
# 3: Calculate the mean of 'coralCoverPreDisturbance' (same as original coralCoverPreDisturbance, which is already an average)
# 4: Create a new column 'status' based on a conditional statement, whther relative is
summary_coralcover_absreldiv <- mod_coralcover_relative |>
  group_by(site, year) |>
  summarise(
    mean_coralcover = mean(coralcover),
    sd_coralcover = sd(coralcover),
    mean_coralcover_relative = mean(coralcover_relative),
    sd_coralcover_relative = sd(coralcover_relative),
    mean_coraldiversity = mean(simpson_diversity),
    sd_coraldiversity = sd(simpson_diversity),
    coralCoverPreDisturbance = mean(coralCoverPreDisturbance)
  ) |>
  mutate(status = ifelse(mean_coralcover_relative > 0, "recovered", "not recovered"))

# Set 'status' to "pre-disturbance" for certain years
summary_coralcover_absreldiv$status[which(
  summary_coralcover_absreldiv$year %in% c(predisturbance_interval[1]:predisturbance_interval[2])
)] <-
  "pre-disturbance"

# Left join 'summary_coralcover_absreldiv' with selected columns from 'sitedat' based on 'site'
summary_coralcover_absreldiv <- summary_coralcover_absreldiv |>
  left_join(sitedat |>
              select(c(site, depth)), by = "site")

# Convert 'site' column to a factor
summary_coralcover_absreldiv$site <-
  factor(summary_coralcover_absreldiv$site)

# Reorder levels of 'site' based on 'depth'
summary_coralcover_absreldiv$site <-
  reorder(summary_coralcover_absreldiv$site,
          summary_coralcover_absreldiv$depth,
          FUN = mean)

# Reorder levels of 'site' again based on 'coralCoverPreDisturbance'
summary_coralcover_absreldiv$site <-
  reorder(
    summary_coralcover_absreldiv$site,
    summary_coralcover_absreldiv$coralCoverPreDisturbance,
    FUN = mean
  )

# Convert 'status' column to a factor with specific levels
summary_coralcover_absreldiv$status <-
  factor(
    summary_coralcover_absreldiv$status,
    levels =  c("pre-disturbance", "not recovered", "recovered")
)numeric(0)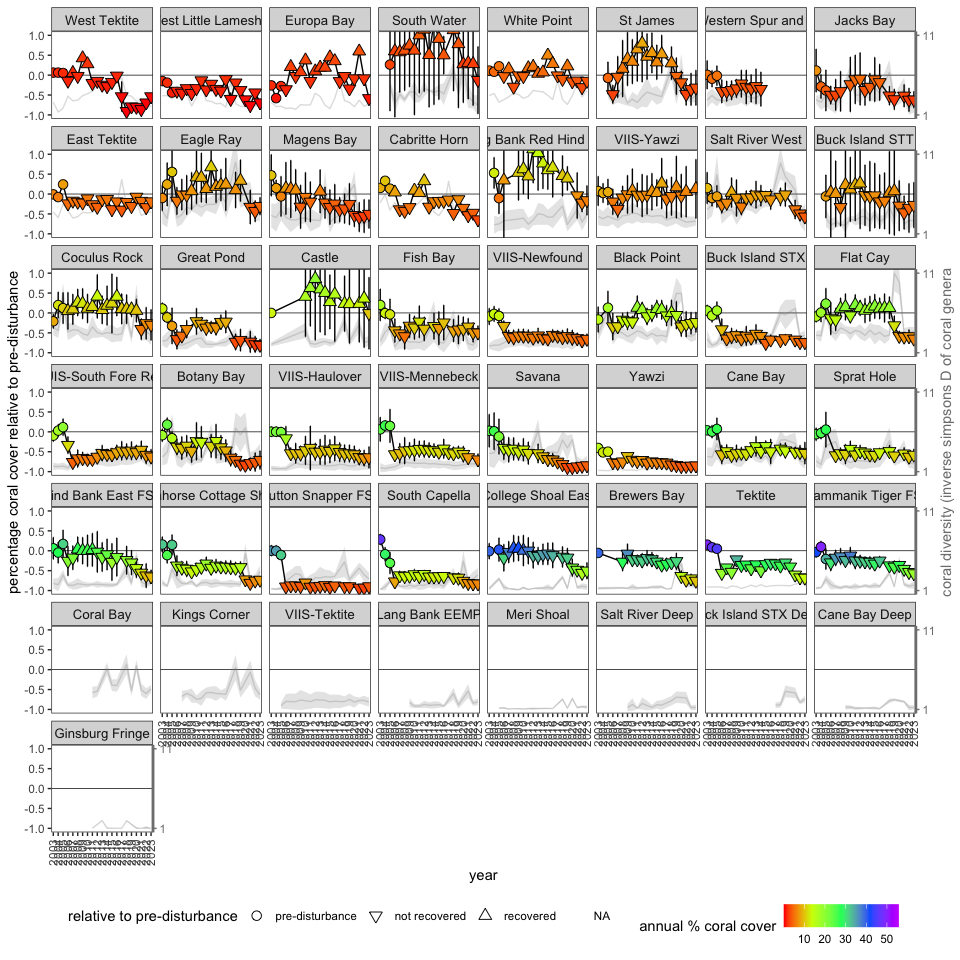
this will allow to load in next steps
The resilience metrics derived on this page are saved to the shared workspace and offered for download in the next section.