5.4 NMDS of coral genera during the recovery period

Last updated

July 6, 2026

5.4 NMDS of coral genera during the recovery period

On this page

This page runs a non-metric multidimensional scaling (NMDS) ordination on coral-genera percent cover across the 2007 to 2017 recovery period. It builds a site-by-genera community matrix, fits the NMDS with a Bray-Curtis distance, and produces biplots that trace how coral community composition shifted over time at each site. The interactive dashboard and the derived percent-cover table let you explore the underlying data directly.

Data sources

This page uses annual coral-genera percent cover derived from the benthic-cover surveys of the Territorial Coral Reef Monitoring Program (tcrmp), the Virgin Islands National Park Service reef monitoring (vinps), and the California State University Northridge surveys (csun). The genera-level percent-cover product read here is available in the Downloads section below.

Import data and metadata

Here we import cover of coral genera into data as well as associated metadata and sitedat.

Show code
benthicCoverCoralGeneraFile <- latest_output("s2pt4_benthicCoverCoralGenera")

data <- read.csv(paste("../../outputs/",benthicCoverCoralGeneraFile,".csv",sep=""))
metadata <- readLines(paste("../../outputs/",benthicCoverCoralGeneraFile,".txt",sep=""))
sitedat <- read.csv("../../../RRSdata/00_RRS_dataCatalogStatus/00_RRS_siteMaster_allSites_data.csv")
Interactive dashboard

Explore the complete coral-genera percent-cover dataset behind this section. The plot shows mean percent cover through time for the most abundant genera; the table is the entire dataset, searchable and filterable by any column.

Table shows a random sample of 15,000 of 219,964 rows. The plot above uses every row.

View metadata

###############################
filename: s2pt4_benthicCoverCoralGenera_49sites_1987_2023.csv
date: 2026-07-06 01:33:05.158472
description: aggregated surveyed coral species by genera and annual percent cover at 35 sites. The idea to use coral genera is based on coral genera groupings in `csun_random_benthicDat` , resilience of coral genera scored by @vanwoesik2012 , and analyses of coral genera frequency by @longterm_moritz_2021
###############################

column names:
year program date site period replicate replicatetype coralGenera perccover pres

column: year
description: survey year
Data Type: numeric
Mean: 2012.58813260352
Min: 1987
Max: 2023

column: program
description: monitoring program
Data Type: character
Unique Values: (showing all 3 entries)
   TCRMP
   VINPS
   CSUN

column: date
description: date of survey
Data Type: Date
Date Range: 1987-06-01 to 2023-12-07

column: site
description: survey site
Data Type: character
Unique Values: (showing all 49 entries)
   Cane Bay
   Eagle Ray
   Lang Bank Red Hind FSA
   Jacks Bay
   Buck Island STX
   Salt River West
   Coculus Rock
   Magens Bay
   Sprat Hole
   Fish Bay
   Brewers Bay
   Botany Bay
   Hind Bank East FSA
   Castle
   Grammanik Tiger FSA
   College Shoal East
   Mutton Snapper FSA
   Flat Cay
   Seahorse Cottage Shoal
   Great Pond
   Black Point
   Savana
   South Capella
   Buck Island STT
   South Water
   St James
   Meri Shoal
   Kings Corner
   Salt River Deep
   Lang Bank EEMP
   Cane Bay Deep
   Ginsburg Fringe
   Coral Bay
   Buck Island STX Deep
   VIIS-Newfound
   VIIS-Yawzi
   VIIS-Mennebeck
   VIIS-Haulover
   VIIS-Tektite
   BUIS-Western Spur and Groove
   BUIS-South Fore Reef
   Cabritte Horn
   East Tektite
   Europa Bay
   West Little Lameshur
   West Tektite
   White Point
   Yawzi
   Tektite

column: period
description: monitoring period
Data Type: character
Unique Values: (showing all 6 entries)
   Annual
   PeakBL
   WS
   SCTLD
   PostBL
   NA

column: replicate
description: replicate number/identifier
Data Type: character
Unique Values: (showing all 20 entries)
   1
   2
   3
   4
   5
   6
   7
   8
   9
   10
   11
   12
   13
   14
   15
   16
   17
   18
   19
   20

column: replicatetype
description: type of replicate
Data Type: character
Unique Values: (showing all 2 entries)
   transect
   site

column: coralGenera
description: coral genus
Data Type: character
Unique Values: (showing all 29 entries)
   Millepora
   Dendrogyra
   Acropora
   Orbicella
   Scolymia
   Porites
   Mycetophyllia
   Mussa
   Madracis
   Isopyhyllastrea
   unknown
   unknown juv.
   Helioseris
   Oculina
   Solenastrea
   Tubastraea
   Stephanocoenia
   Siderastrea
   Montastraea
   Meandrina
   Favia
   Eusmilia
   Diploria
   Dichocoenia
   Colpophyllia
   Pseudodiploria
   Manicina
   Agaricia
   Isophyllia

column: perccover
description: percentage cover of that coral genus
Data Type: numeric
Mean: 0.414024306680286
Min: 0
Max: 74.23

column: pres
description: presence/absence of that coral genus
Data Type: numeric
Mean: 0.160589914713281
Min: 0
Max: 1

siteres : get summary of site/year replication Creating a summary table siteres that joins the main dataset with site-specific data. This table provides a breakdown of replication by site and year.

Show code
siteres <-
  data |>
  full_join(sitedat |> select(site), by = "site") |>
  group_by(site, year) |>
  summarise(nreplicate = length(unique(replicate))) |> pivot_wider(names_from = year, values_from = nreplicate) |>
  select(-"NA")

kbl(siteres) |>
  kable_paper(full_width = F) |>
  kable_styling(
    fixed_thead = T,
    bootstrap_options = c("hover", "condensed"),
    font_size = 8
  ) |>
  scroll_box(width = "200%", height = "250px")
site 2002 2003 2004 2005 2006 2007 2008 2009 2010 2011 2012 2013 2014 2015 2016 2017 2018 2019 2020 2021 2022 2023 2000 2001 1992 1993 1994 1995 1996 1997 1998 1999 1987 1988 1989 1990 1991
BUIS-South Fore Reef 20 20 20 20 20 20 20 20 20 20 20 20 20 20 20 20 20 20 20 20 20 20 NA NA NA NA NA NA NA NA NA NA NA NA NA NA NA
BUIS-Western Spur and Groove 19 20 20 20 20 20 20 20 20 20 20 20 20 NA NA NA NA NA NA NA NA NA 19 19 NA NA NA NA NA NA NA NA NA NA NA NA NA
Black Point NA 6 NA 6 6 6 6 6 6 6 6 6 6 6 6 6 6 6 6 6 6 6 NA NA NA NA NA NA NA NA NA NA NA NA NA NA NA
Botany Bay 6 6 6 6 6 6 6 6 6 5 NA 6 6 6 6 6 6 6 6 6 6 6 NA NA NA NA NA NA NA NA NA NA NA NA NA NA NA
Brewers Bay 6 6 NA NA NA NA 6 6 6 6 6 6 6 6 6 6 6 6 6 6 6 6 NA NA NA NA NA NA NA NA NA NA NA NA NA NA NA
Buck Island STT NA NA NA 6 6 6 6 6 6 6 6 6 6 6 6 6 6 6 6 6 6 6 NA NA NA NA NA NA NA NA NA NA NA NA NA NA NA
Buck Island STX 3 6 6 6 6 6 6 6 6 6 6 6 6 6 6 NA 6 6 NA 6 6 6 NA 3 NA NA NA NA NA NA NA NA NA NA NA NA NA
Buck Island STX Deep NA NA NA NA NA NA NA NA NA NA NA NA NA NA NA 6 6 6 NA 6 6 6 NA NA NA NA NA NA NA NA NA NA NA NA NA NA NA
Cabritte Horn 1 1 1 1 1 1 1 1 1 1 1 1 1 1 1 1 1 1 1 1 1 1 1 1 1 1 1 1 1 1 1 1 NA NA NA NA NA
Cane Bay 6 6 6 6 6 6 6 6 6 6 6 6 6 6 6 NA 6 6 NA 6 6 6 NA 6 NA NA NA NA NA NA NA NA NA NA NA NA NA
Cane Bay Deep NA NA NA NA NA NA NA 6 6 6 6 6 6 6 6 NA 6 6 NA 6 6 6 NA NA NA NA NA NA NA NA NA NA NA NA NA NA NA
Castle NA 6 NA NA NA NA NA NA 6 6 6 6 6 6 6 NA 6 6 NA 6 6 6 NA NA NA NA NA NA NA NA NA NA NA NA NA NA NA
Coculus Rock 6 6 6 6 6 6 6 6 6 6 6 6 6 6 6 6 6 6 6 6 6 6 NA 6 NA NA NA NA NA NA NA NA NA NA NA NA NA
College Shoal East NA 6 NA 6 6 6 6 6 6 6 6 6 6 6 6 NA 6 6 6 6 5 5 NA NA NA NA NA NA NA NA NA NA NA NA NA NA NA
Coral Bay NA NA NA NA NA NA NA NA NA 6 6 NA 6 6 6 NA 6 6 6 6 6 6 NA NA NA NA NA NA NA NA NA NA NA NA NA NA NA
Eagle Ray 6 6 6 6 6 6 6 6 6 6 6 6 6 6 6 NA 6 6 NA 6 6 6 NA 6 NA NA NA NA NA NA NA NA NA NA NA NA NA
East Tektite 1 1 1 1 1 1 1 1 1 1 1 1 1 1 1 1 1 1 1 1 1 1 1 1 1 1 1 1 1 1 1 1 NA NA NA NA NA
Europa Bay 1 1 1 1 1 1 1 1 1 1 1 1 1 1 1 1 1 1 1 1 1 1 1 1 1 1 1 1 1 1 1 1 NA NA NA NA NA
Fish Bay 6 6 6 6 6 6 6 6 6 6 6 NA 6 6 6 NA 6 6 6 6 6 6 NA 6 NA NA NA NA NA NA NA NA NA NA NA NA NA
Flat Cay NA 6 6 6 6 6 6 6 6 6 6 6 6 6 6 6 6 6 6 6 6 6 NA NA NA NA NA NA NA NA NA NA NA NA NA NA NA
Ginsburg Fringe NA NA NA NA NA NA NA NA NA 6 NA 6 6 6 NA 6 6 NA 6 6 6 6 NA NA NA NA NA NA NA NA NA NA NA NA NA NA NA
Grammanik Tiger FSA NA 6 10 6 6 6 6 6 6 6 6 6 6 6 6 NA 6 6 6 6 6 6 NA NA NA NA NA NA NA NA NA NA NA NA NA NA NA
Great Pond NA 6 6 6 6 6 6 NA 6 6 6 6 6 6 6 NA 6 6 NA 6 6 6 NA NA NA NA NA NA NA NA NA NA NA NA NA NA NA
Hind Bank East FSA NA 6 10 6 6 6 6 6 6 6 6 6 6 6 6 NA 6 6 6 6 6 6 NA NA NA NA NA NA NA NA NA NA NA NA NA NA NA
Jacks Bay 6 6 6 6 6 6 6 NA 6 6 6 6 6 6 6 NA 6 6 NA 6 6 6 NA 6 NA NA NA NA NA NA NA NA NA NA NA NA NA
Kings Corner NA NA NA NA NA 6 6 6 6 6 6 6 6 6 6 NA 6 6 NA 6 6 6 NA NA NA NA NA NA NA NA NA NA NA NA NA NA NA
Lang Bank EEMP NA NA NA NA NA NA NA 6 6 6 6 6 6 6 6 NA 6 6 NA 6 6 6 NA NA NA NA NA NA NA NA NA NA NA NA NA NA NA
Lang Bank Red Hind FSA 5 NA 6 4 6 NA NA 6 6 6 6 6 6 6 6 NA 6 6 NA 6 6 6 NA 6 NA NA NA NA NA NA NA NA NA NA NA NA NA
Magens Bay 6 6 6 6 5 6 6 6 6 6 NA 6 6 6 6 6 6 6 6 6 6 6 NA 6 NA NA NA NA NA NA NA NA NA NA NA NA NA
Meri Shoal NA NA NA 6 6 6 5 6 6 6 6 6 6 6 6 NA 6 6 6 6 6 6 NA NA NA NA NA NA NA NA NA NA NA NA NA NA NA
Mutton Snapper FSA NA 6 6 6 6 6 6 6 6 5 6 6 6 6 6 NA 6 6 NA 6 6 6 NA NA NA NA NA NA NA NA NA NA NA NA NA NA NA
Neptunes Table NA NA NA NA NA NA NA NA NA NA NA NA NA NA NA NA NA NA NA NA NA NA NA NA NA NA NA NA NA NA NA NA NA NA NA NA NA
SARI-Salt River NA NA NA NA NA NA NA NA NA NA NA NA NA NA NA NA NA NA NA NA NA NA NA NA NA NA NA NA NA NA NA NA NA NA NA NA NA
Salt River Deep NA NA NA NA NA NA NA 6 6 5 6 6 6 6 6 NA 6 6 NA 6 6 6 NA NA NA NA NA NA NA NA NA NA NA NA NA NA NA
Salt River West 6 6 6 6 6 6 6 6 6 6 6 6 6 6 6 NA 6 6 NA 6 6 6 NA 6 NA NA NA NA NA NA NA NA NA NA NA NA NA
Savana NA 6 6 6 6 6 6 6 6 6 NA 6 6 6 6 6 6 6 6 6 6 6 NA NA NA NA NA NA NA NA NA NA NA NA NA NA NA
Seahorse Cottage Shoal NA 6 10 6 6 6 6 6 6 6 6 6 6 6 6 6 6 6 6 6 6 6 NA NA NA NA NA NA NA NA NA NA NA NA NA NA NA
South Capella NA 6 10 6 6 6 6 6 6 6 6 6 6 6 6 NA 6 6 6 6 6 6 NA NA NA NA NA NA NA NA NA NA NA NA NA NA NA
South Water NA NA NA 6 6 6 6 6 6 6 6 6 6 6 6 NA 6 6 6 6 6 6 NA NA NA NA NA NA NA NA NA NA NA NA NA NA NA
Sprat Hole 5 6 6 6 NA 6 6 6 6 6 6 6 6 6 6 NA 6 6 NA 6 6 6 NA 6 NA NA NA NA NA NA NA NA NA NA NA NA NA
St James NA NA NA 6 6 6 6 6 6 6 6 6 6 6 6 NA 6 6 6 6 6 6 NA NA NA NA NA NA NA NA NA NA NA NA NA NA NA
Tektite 1 1 1 1 1 1 1 1 1 1 1 1 1 1 1 1 1 1 1 1 1 1 1 1 1 1 1 1 1 1 1 1 1 1 1 1 1
VIIS-Haulover NA 20 20 20 20 20 20 20 20 20 20 20 20 20 20 20 20 20 20 20 20 20 NA NA NA NA NA NA NA NA NA NA NA NA NA NA NA
VIIS-Mennebeck 20 20 20 20 20 20 20 20 20 20 20 20 20 20 20 19 20 20 20 20 NA 20 20 20 NA NA NA NA NA NA NA NA NA NA NA NA NA
VIIS-Newfound 20 20 20 20 20 20 20 20 20 20 20 20 20 20 20 20 20 20 20 20 20 20 20 20 NA NA NA NA NA NA NA 20 NA NA NA NA NA
VIIS-Tektite NA NA NA 20 20 20 20 20 20 20 20 20 20 20 20 20 20 20 20 20 20 20 NA NA NA NA NA NA NA NA NA NA NA NA NA NA NA
VIIS-Yawzi 20 20 20 20 20 20 20 20 20 20 20 20 20 20 20 20 20 20 20 20 NA 20 20 20 NA NA NA NA NA NA NA 20 NA NA NA NA NA
West Little Lameshur 1 1 1 1 1 1 1 1 1 1 1 1 1 1 1 1 1 1 1 1 1 1 1 1 1 1 1 1 1 1 1 1 NA NA NA NA NA
West Tektite 1 1 1 1 1 1 1 1 1 1 1 1 1 1 1 1 1 1 1 1 1 1 1 1 1 1 1 1 1 1 1 1 NA NA NA NA NA
White Point 1 1 1 1 1 1 1 1 1 1 1 1 1 1 1 1 1 1 1 1 1 1 1 1 1 1 1 1 1 1 1 1 NA NA NA NA NA
Yawzi 1 1 1 1 1 1 1 1 1 1 1 1 1 1 1 1 1 1 1 1 1 1 1 1 1 1 1 1 1 1 1 1 1 1 1 1 1

Generating a summarized dataset datasum that averages percent cover across transects for each coral genera. This dataset is then reshaped to a wider format and missing values are replaced with zeros.

Show code
datasum <- data |>
  group_by(site, year, coralGenera) |>
  summarise(perccov = mean(perccover))

datasum <- datasum |>
  pivot_wider(names_from = coralGenera, values_from = perccov)

datasum[is.na(datasum)] <- 0

NMDS

make community_matrix Filtering the data to focus on the years between 2007 and 2017, extracting only the data-containing columns from datasum to get community_matrix, and then removing columns representing genera with <75%ile of total abundance across sites.

Show code
datasum <- datasum |>
  filter(year>2006 & year<2018)

#make matrix of data
community_matrix <-
  datasum[, 3:ncol(datasum)] # Adjust columns as needed

#removing 75% of species with lowest occurrences so metamds will converge
coltorm <- which(as.logical(colSums(community_matrix) <
                              quantile(colSums(community_matrix))[[4]]))
community_matrix <- community_matrix[, -coltorm]

Conducting a Non-metric multidimensional scaling (NMDS) analysis on the community matrix using the Bray-Curtis distance measure, allowing for multiple tries to ensure convergence.

Show code
nmds <- metaMDS(community_matrix,
                dist = "bray",
                trymax = 40,
                k = 3)

display the basic statistics and results derived from the NMDS analysis.

Show code
nmds

Call:
metaMDS(comm = community_matrix, distance = "bray", k = 3, trymax = 40) 

global Multidimensional Scaling using monoMDS

Data:     wisconsin(community_matrix) 
Distance: bray 

Dimensions: 3 
Stress:     0.129092 
Stress type 1, weak ties
Best solution was repeated 1 time in 20 tries
The best solution was from try 13 (random start)
Scaling: centring, PC rotation, halfchange scaling 
Species: expanded scores based on 'wisconsin(community_matrix)' 

preparing for plot Extracting the coordinates from the NMDS results to prepare for visualization. The coordinates are enriched with additional metadata such as site depth. The data is then arranged for sequential plotting.

Show code
# Extract NMDS coordinates
nmds_coordinates <- as.data.frame(scores(nmds, display = "sites"))

#continuous grouping var
nmds_coordinates$site <- as.factor(datasum$site)
nmds_coordinates$year <- as.factor(datasum$year)

#join with depth for reordering
nmds_coordinates <- nmds_coordinates |> 
  left_join(sitedat|> select(site,depth), by = "site")
nmds_coordinates <-
  nmds_coordinates[order(nmds_coordinates$depth), ]
nmds_coordinates$site <-
  factor(nmds_coordinates$site, levels = unique(nmds_coordinates$site))

nmds_coordinates <- nmds_coordinates |> 
  arrange(site, year)

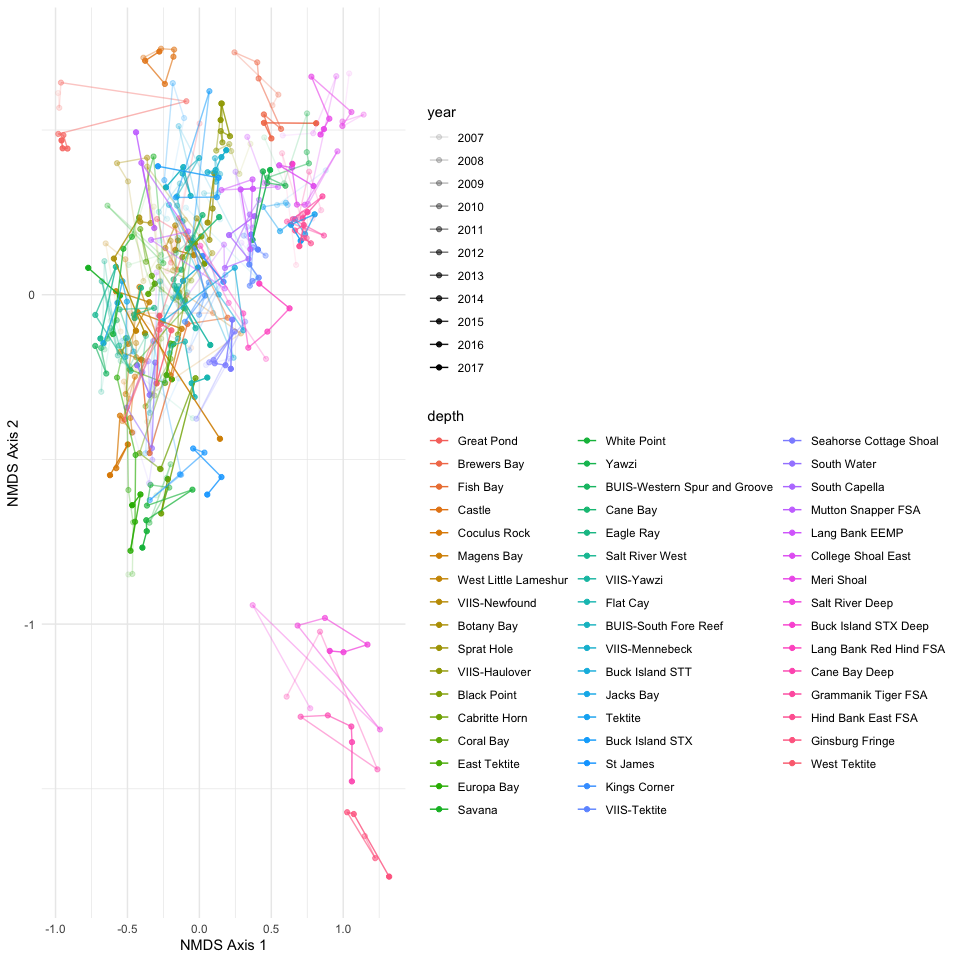
plot the NMDS biplot with lines connecting data from each year, representing the shift in coral genera composition over time at different sites.

Show code
p <- ggplot(nmds_coordinates,
       aes(
         x = NMDS1,
         y = NMDS2,
         color = as.factor(site),
         # group = year
         # shape = site
       )) +
  geom_point(aes(alpha = year)) +
  geom_path(aes(group = site, alpha=year)) +
  # scale_color_gradient(low = "red", high = "blue") + # Define color scale from blue to
  # scale_shape_manual(values=c(16,1))+
  xlab("NMDS Axis 1") +
  ylab("NMDS Axis 2") +
  theme_minimal() +
    labs(
    color = "depth",
    shape = "protection status",
    size = "relief"
  )

p
#ggplotly(p)
Sec 5.4 Figure 1: NMDS biplot of coral community change over time

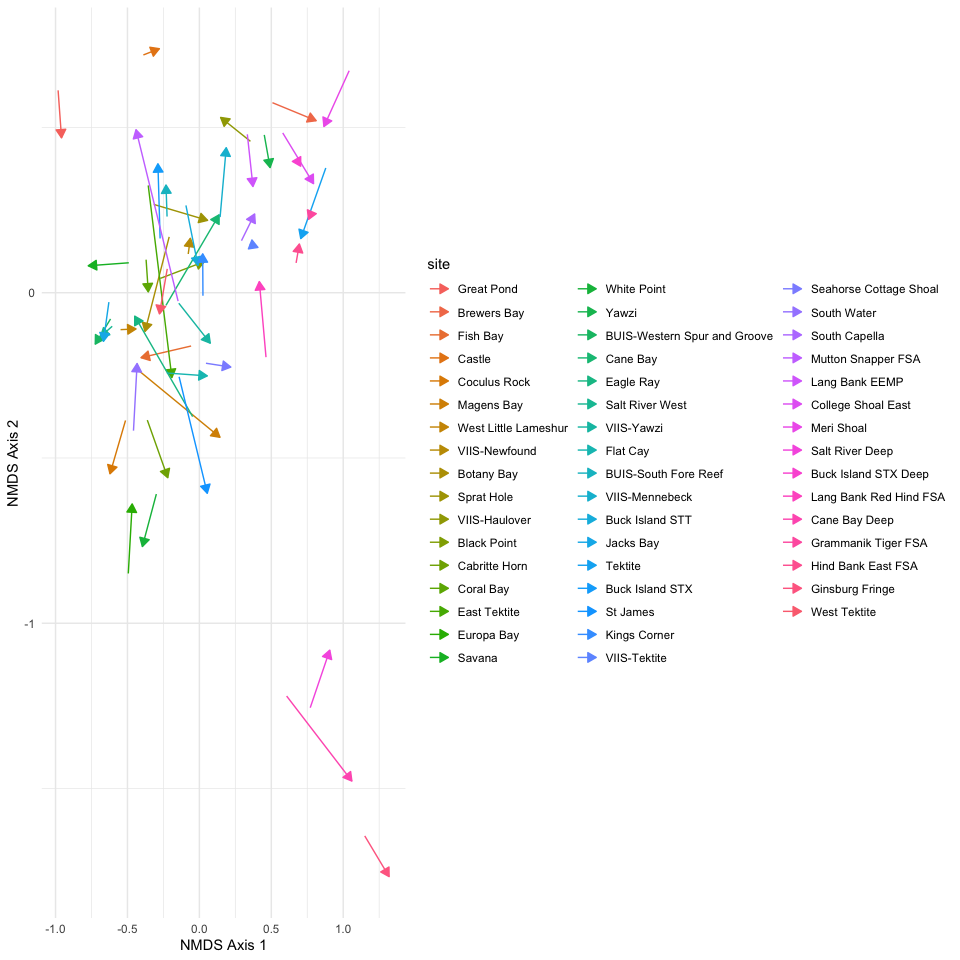
another NMDS biplot with added arrows indicating the direction and magnitude of change in coral genera composition over the years at each site.

Show code
# Build one arrow per site from its earliest to its latest recovery-period year.
# Selecting by each site's own min/max year keeps this correct for any year set
# (the earlier factor-index split assumed a fixed 2007-2017 window).
yr <- function(x) as.numeric(as.character(x))

starts <- nmds_coordinates |>
  group_by(site) |>
  slice_min(yr(year), n = 1, with_ties = FALSE) |>
  ungroup() |>
  transmute(site, x = NMDS1, y = NMDS2)

ends <- nmds_coordinates |>
  group_by(site) |>
  slice_max(yr(year), n = 1, with_ties = FALSE) |>
  ungroup() |>
  transmute(site, xend = NMDS1, yend = NMDS2)

arrow_segments <- dplyr::inner_join(starts, ends, by = "site")

p <- ggplot(arrow_segments,
    aes(
      x = x,
      xend = xend,
      y = y,
      yend = yend,
      group = site,
      color = site
    )) +
  # geom_point(aes(alpha = year)) +
  geom_segment(arrow = arrow(type = "closed", length = unit(0.1, "inches"))) +
  theme_minimal()+
  xlab("NMDS Axis 1") +
  ylab("NMDS Axis 2")

p
Sec 5.4 Figure 2: NMDS biplot of coral community change from start to end of recovery period.

Downloads

This page reads the derived coral-genera percent-cover product that underlies the ordination. Download the data and its metadata sidecar directly from the repository: